
We’re back on land but still dreaming of the RV Celtic Explorer! Especially after seeing this stunning drone footage of the cruise filmed by Paul Stapleton and edit by Frank Armstrong of the Irish Marine Institute.
Water Column Sampling
As a trained “geologist” I am sometimes exasperated when people summarize my work by saying, “oh, so you study rocks.” Most of my research is focused on unconsolidated (loose) marine sediments and my interests lie in the stories they preserve about past oceanographic conditions and climate.
Many of you will have heard about this year’s extraordinary marine heatwaves (Fig 1) that have plagued the North Atlantic and Arctic, now almost annual occurrences superimposed on a background of long term warming that is the undeniable result of anthropogenic greenhouse gas emissions. In addition to the impacts on marine life, warm sea surface temperatures contribute to ice melt and sea level rise, and increase the likelihood of dangerous storms.

Fig 1. Daily global sea surface temperature (°C) averaged over the 60°S–60°N domain plotted as a time series for each year from 1 January 1979 to 31 July 2023. The years 2023 and 2016 are shown with thick lines shaded in bright red and dark red, respectively. Other years are shown with thin lines and shaded according to the decade, from blue (1970s) to brick red (2020s). Data: ERA5. Credit: C3S/ECMWF.
One of our cruise objectives is to monitor how the Arctic is changing, including by documenting physical and chemical changes to the water column. A key instrument for this work is CTD which stands for Conductivity (salinity), Temperature, and Depth (creative name, we know). A standard CTD measures these properties continuously as it is lowered and raised through the water column and our instrument also measures fluorescence (a proxy for photosynthetic activity), and oxygen (a proxy for biological activity and water mass changes) (Fig 2). These properties and their variations with depth and from site to site give us invaluable baseline information about the Arctic and Nordic Seas. In turn, these observations can help us understand how oceanographic circulation patterns are changing and what the implications might be for global deep-water circulation.

Fig 2. A sample CTD profile from a recent station. Depth is along the y axis with the deepest part of the ocean at the bottom of the screen. The color of each line corresponds to the axis, for example temperature is in red. This CTD profile is quite a bit noisier than usual (see the bumps) because of very rough sea conditions (3-4m seas).
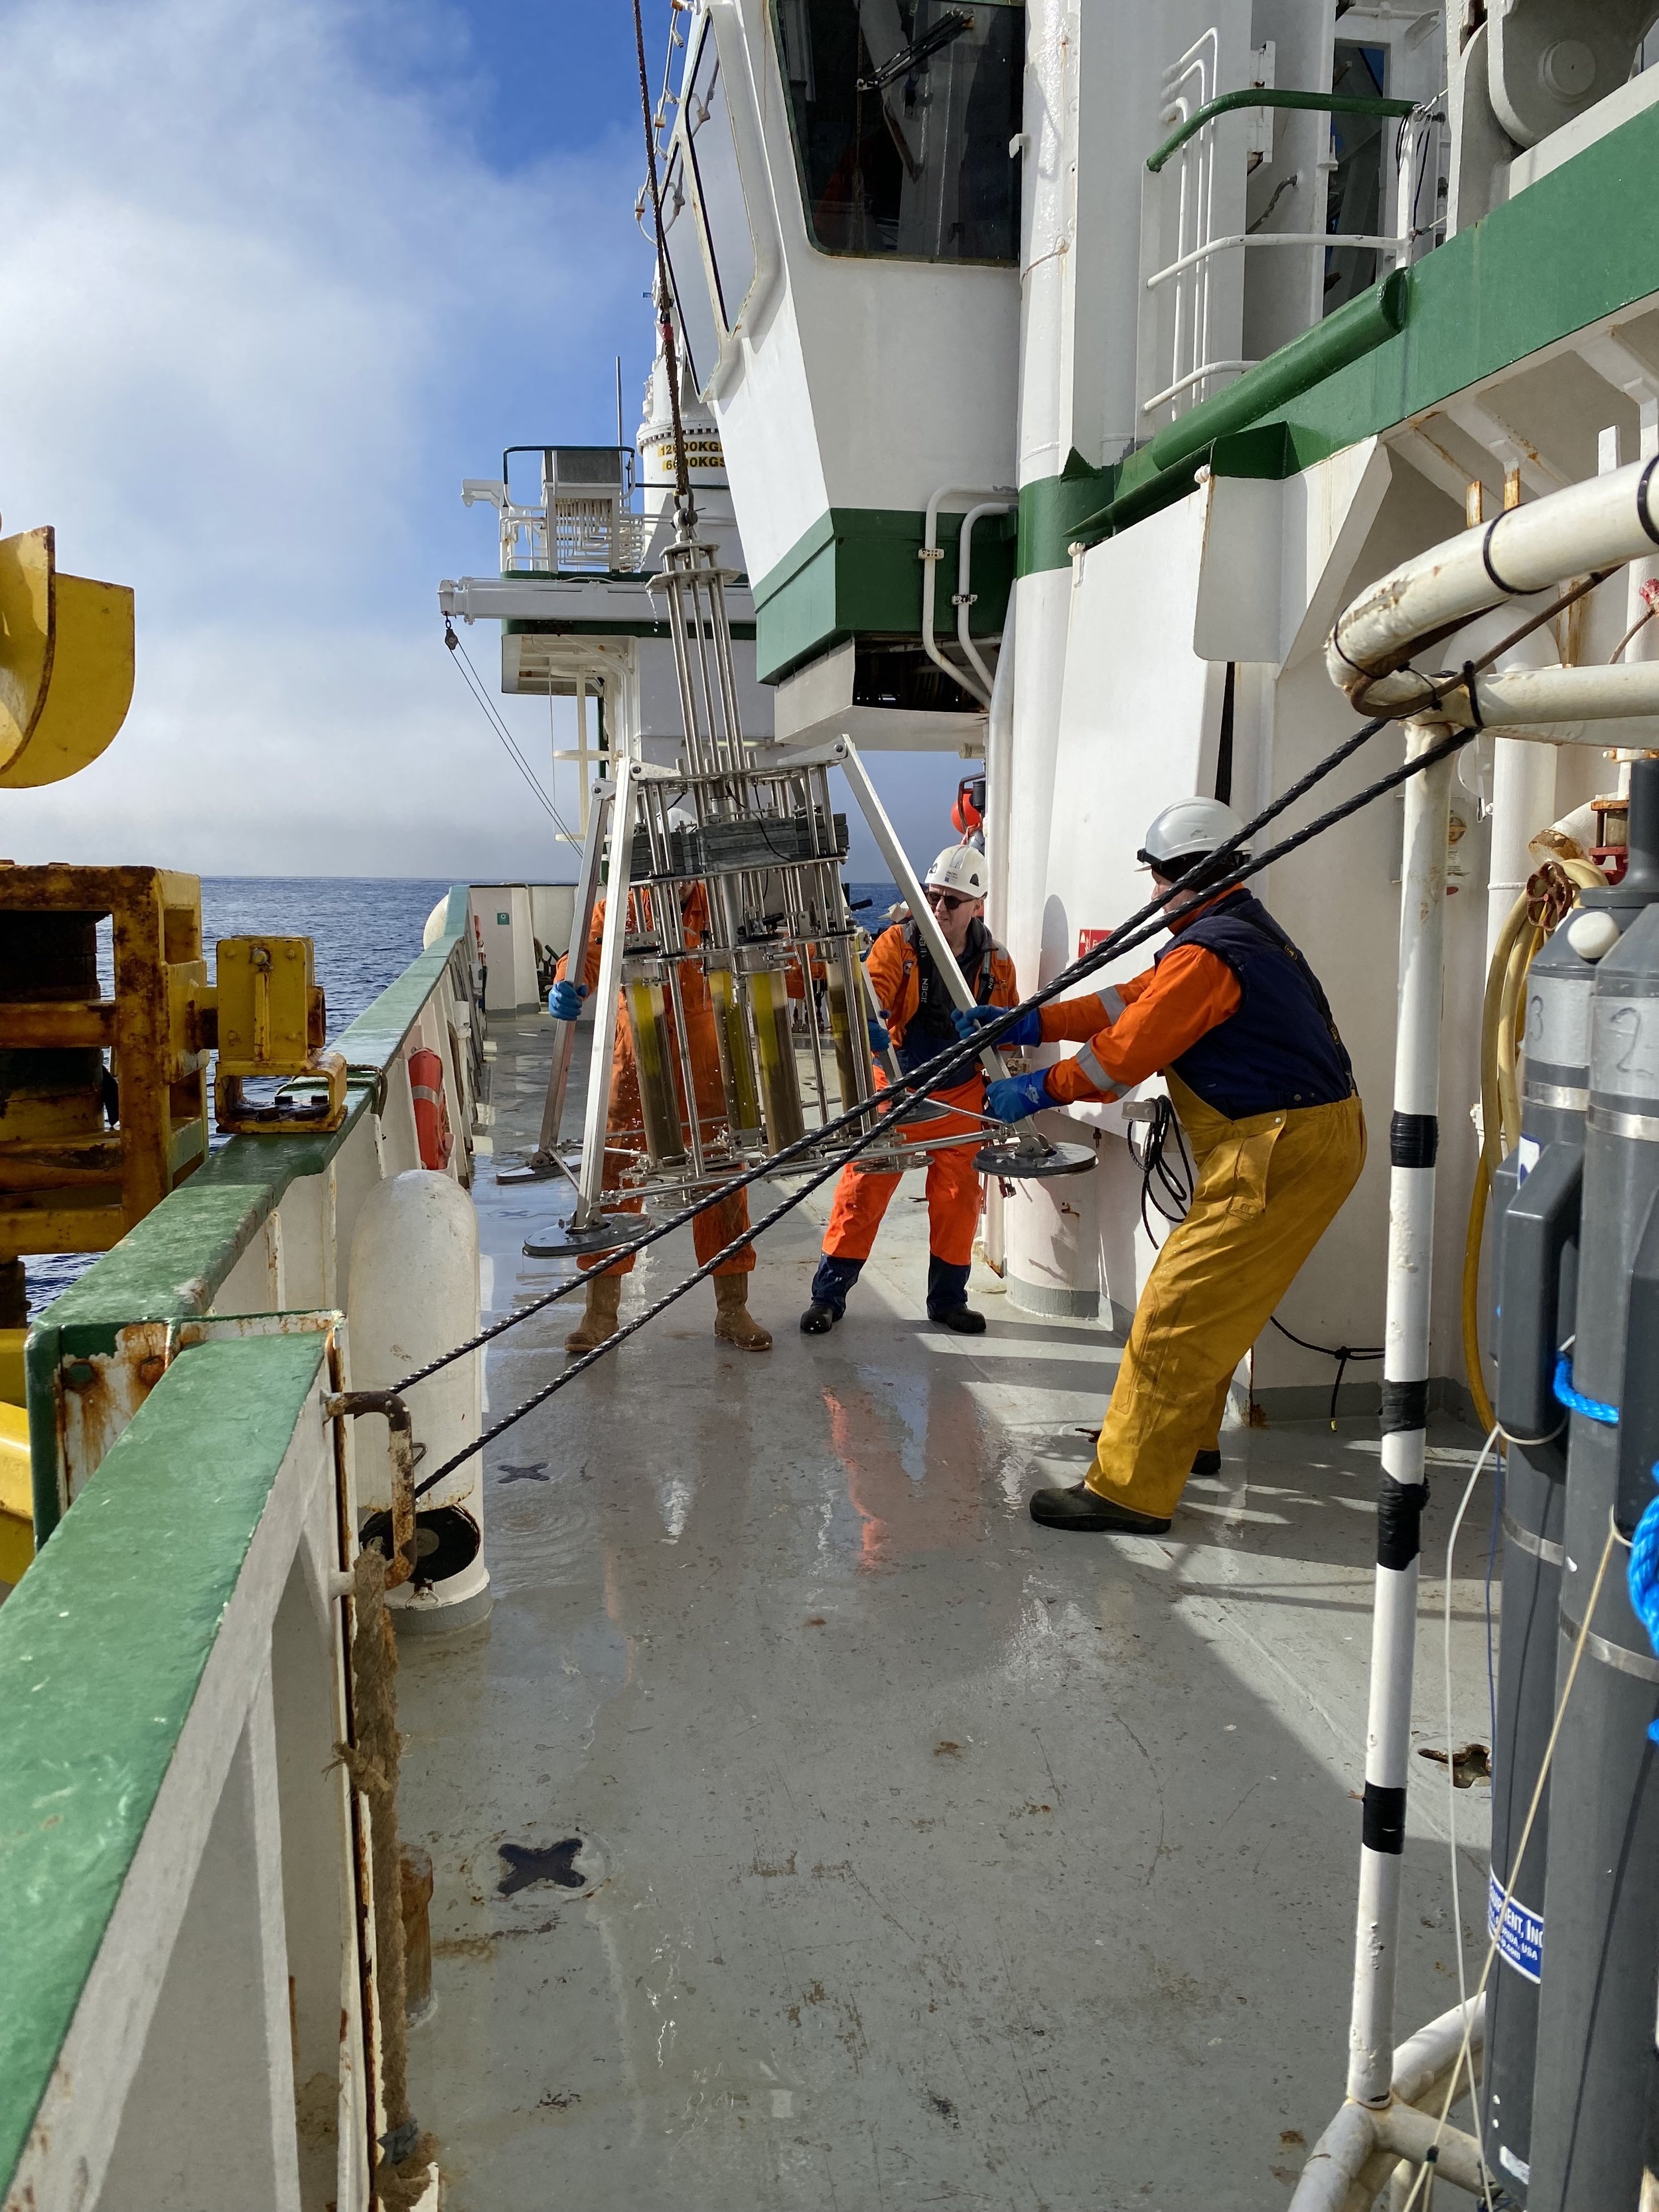
In addition to the water column profiles we obtain from the CTD, we also use the bottles on the instrument to take samples of the water column from discrete depths. I work with the winch operator to deploy the CTD, help Chief Scientist Dr. Morley choose the sample depths, and fire (close) the bottles at the right depths. When the CTD is resting safely on deck, a flurry of activity commences (video) to subsample the big bottles into smaller vials that are measured for isotopes (δ18O and δ13C), alkalinity and dissolved inorganic carbon (DIC) (to constrain the carbonate system), trace elements, and nutrients.
Most of our climate reconstruction work is reliant upon proxies. You might be familiar with this word from voting by ‘proxy’ which means to send someone in your stead to represent your preference. I like to use an analogy to illustrate how this works in the climate context: If you look outside and see people carrying umbrellas, what do you know intuitively? It’s raining! So we might think that umbrellas are a proxy for rain. To make sense of the geochemical information preserved in geologic archives, climate scientists must work hard to make sure they understand the systems and what they are telling us. If you see a pile of umbrellas in a landfill (the sedimentary record) what might you infer? Your first thought might be that it had rained earlier that week. But do you throw away your umbrella the minute it stops raining? Or only after a storm, when the umbrella has been damaged by wind and is beyond repair? Geochemists must diligently assess whether a proxy is a pure recorder of one environmental variable (rain) or whether it is subject to the influence of a secondary variable (strong wind).
The snapshots of ocean properties we obtain from the CTD bottles are critical for our geochemical work on microfossils and sediments. By measuring the environmental variables in the water column and measuring the signals recorded in modern foraminifera and sediments (like the multi cores we are collecting) we can improve our understanding of how proxies work and what paleoclimate information they record.
For example, Dr. Morely and her group are interested in trace element incorporation into planktonic (surface-dwelling) foraminifera. They are working diligently to quantify how trace elements like magnesium (Mg) are incorporated into calcite as a function of temperature, carbonate chemistry, and other variables. A second step is to understand how this primary geochemical signal may be altered by sedimentary processes as the foraminifera become part of the geologic record.
This is the difficult, but critical work of geochemists. Only with a clear understanding of past variability can we accurately predict and prepare for future changes in our climate system.
Video. CE23011 Scientists sampling the CTD.
Icebergs Spotted
For days now we have been dodging floating icebergs. They’ve blocked us from reaching our last few sampling stations and we’ve been forced to pull up equipment early for fear of being locked in the ice. This morning, as the sun rose and burned off the fog that has enshrouded us for almost a week, the light glinted off more than a dozen icebergs, and this afternoon we’ve repeatedly swerved and altered our route to avoid collisions (Fig 1).

Fig 1 - Track - Normally we sail in straight lines between our stations. For the past several days we’ve had to carefully make our way around the ice, occasionally making sharp turns to avoid big icebergs.
Even though they are literally putting kinks in our plans, I have to admit to being thrilled by the sight of these gleaming sculptures of ice (Fig 2). Not only do they make for spectacular photographs, they’re also the modern analogue of one of the phenomena we’re studying aboard the RV Celtic Explorer.
My name is Dr. Allison Jacobel and I’m an Assistant Professor at Middlebury College in the Department of Earth and Climate Sciences. Together with Ashley Rodriguez, an undergraduate in my lab at Middlebury, Apollonia Arellano, a new graduate student at Columbia University’s Lamont-Doherty Earth Observatory (where I earned my PhD), and the other scientists aboard cruise CE23011 we are studying the record of Earth’s past climate preserved in marine sediments. These layers of sediment and the microfossils they preserve, can tell us about the ocean’s past temperature, salinity, productivity and how it moved heat around the planet.
One of the key things about the sediments below our ship is that they are full of rocks. These rocks didn’t float out to sea on their own, but were instead picked up by ice streams and glaciers on land and then, as they calved into the ocean, carried out to sea on icebergs (Fig 3). The ‘ice rafted debris’ we find in our sediment cores indicate the silent passage of icebergs decades to thousands of years ago.

Fig 2 - An iceberg floating by close to the ship.
Twenty-one thousand years ago Long Island sat at the foot of an enormous glacier fed by an ice sheet that covered the greater part of North America. This was the Last Glacial Maximum, the most recent ice age. Our transition from the LGM, when Middlebury was covered by almost a mile of ice, to the warm climate of the present was not a smooth one. Research, including work by my Ph.D. advisor Dr. Jerry McManus and myself, has shown that the deglacial transition was punctuated by armadas of icebergs that flowed into the ocean and disrupted deep water circulation with implications for the climate of our entire planet. Studying the history of iceberg delivery in the Arctic is an important way to help us understand abrupt changes in climate and to shed light on the sensitivity of the climate system to additions of freshwater. We’re also interested in sedimentological properties like the size distribution in the fine fraction which can help us determine paleo current speeds.
Today the Arctic is experiencing a rate of warming faster than almost any other place on Earth. Dramatic ice loss is occurring from the Greenland Ice Sheet and this year, the Arctic seas have experienced record-breaking sea surface temperatures. Although our work on the RV Celtic Explorer is focused on past changes, our results are also important for modern climate prediction efforts. Observational data are currently equivocal about how the Atlantic Meridional Overturning Circulation is changing, but new results (explainer article here) suggest it may cross a tipping point as soon as mid-century. Understanding how past inputs of meltwater affected circulation is critical to improving these models and climate forecasts.
I believe there is immense value in showing people the beauty of our planet, teaching about the marvelous improbability of our existence, the fascinating intricacies of Earth systems, the fragility of the ecosystems we depend on. It is inarguable that we are on the wrong path, that we are doing catastrophic damage to our planet, and that we are changing our behavior too slowly. My hope is that the photographs, stories, and data I share will help motivate people to demand action on climate change, especially Middlebury students whose career choices will help determine the kind of impact they will have on our planet and our future. This is an incredibly important time to be alive, to understand the costs of our actions, and to change course. It is not too late to do what we can to protect our planet, and it never will be. The time to act is now.
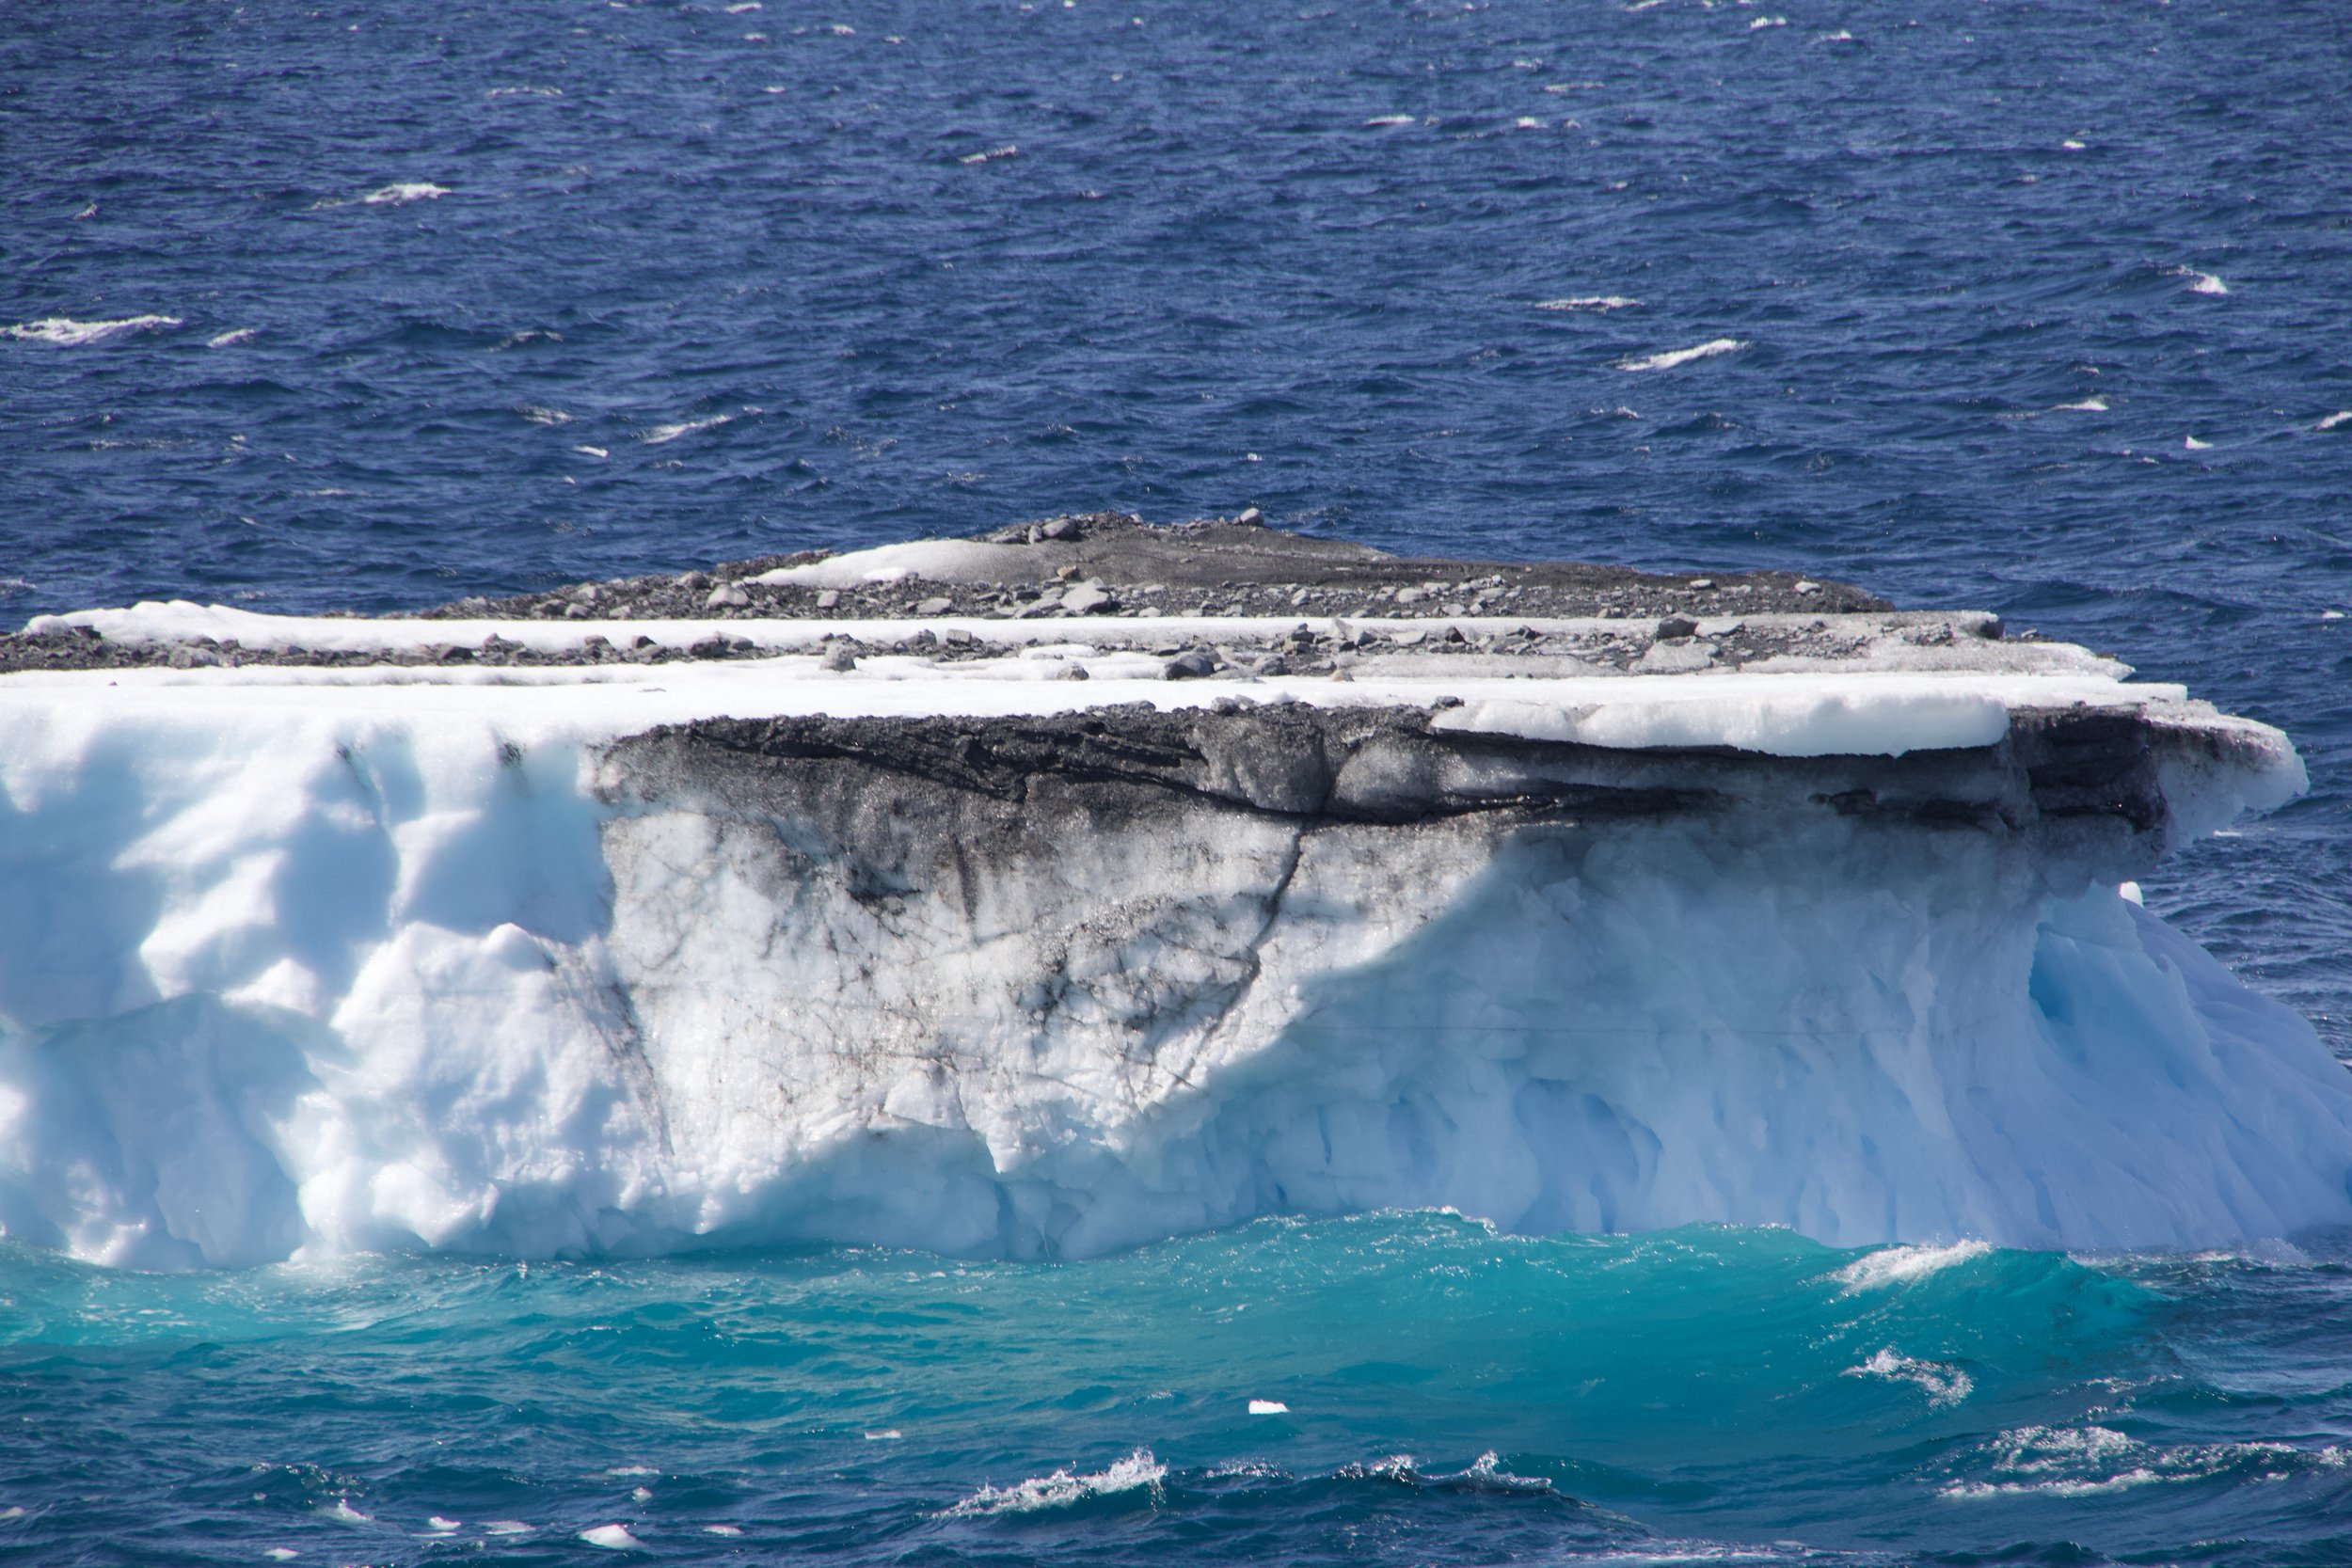
Fig 3 - A dirty iceberg carrying ice rafted debris (IRD).
Modified from a blog by A. Jacobel originally posted 7/29/2017 from the RRS Discovery
More Intros + Multicore Sampling
Greetings from the RV Celtic Explorer! A crew of 18 scientists (including Dr. Allison Jacobel, Ashley Rodriguez, and myself) has set sail from the charming Irish town of Killybegs to partake in the SiTrAc (Signal Tracking to unveil Arctic Climate variability) expedition under the leadership of Dr. Audrey Morley. Although this research cruise has many goals and objectives, I’ll only mention my favorite: “to assess modern and past deep water mass exchanges between the Arctic and Nordic Seas, which are crucial contributors to dynamical heat transport by the ocean and play an important role in setting the climate in the circum-North-Atlantic region.” My name is Apollonia and I’m a first-year paleoceanography graduate student at Columbia University’s Lamont-Doherty Earth Observatory fascinated by the role of ocean circulation in abrupt climate change, so this is very exciting work to be involved in!
One of our key roles in the wet lab is processing the marine sediment core samples taken at each station. We’re collecting sediments using two different methods: gravity cores and multi cores. Multi cores are taken by a device that holds an array of four tubes, each a little shorter than a meter in length (see picture). This device, called a multi corer, is utilized to collect four bottom water samples (the water directly overlying the sediment), undisturbed sediment samples (the most recently deposited layers of sediment), and pore water samples (water contained in the pore space of these sediments).
Once the cores are collected and safely in the wet lab, the dirty work begins (my favorite part)! We place the cores on a multi core slicer, a device used to help us extrude the sediment in portions 0.5 cm in length. Every full turn of the slicer pushes one centimeter of sediment above the neck of the tube and allows us to use two metal spatulas to slice and scrape the sediment precisely—I kind of feel like one of those people who prepare the overpriced rolled ice cream. We then place our mud samples in tiny sample bags and store them in a freezer onboard to preserve them for other scientists (like me!) to analyze in the future.
Not only is this my first time on a research cruise, but it’s also my first time dealing with fresh marine sediment cores. Let me tell you—there’s quite a difference! There’s the obvious difference in water content, of course. But there are also certain features you can observe in a fresh core that you can’t in freeze-dried samples. Processing a fresh core is an experience for the senses! The first I noticed was the smell—some parts of the core smell like what you’d expect mud to. Then, suddenly, you’ll slice into a layer releasing a pungent sulfurous scent! Although somewhat unpleasant, this lovely smell can tell you about what’s happening in your sample. You just can’t get this fabulous experience, or sedimentological information, by looking at freeze-dried samples. I am glad to have experienced what fresh samples look, feel, and smell like because it is a reminder that you don’t always get the full picture by looking at processed samples. Of course, the bulk and trace element chemistry of the samples is revealed by analytical methods—not the qualitative observations I mentioned (more on that soon). Even so, as geologists studying an incredibly thin outcrop (our sediment core) it helps to gather as much information as possible to unearth a fuller story. A wise man once told me, “the best geologist is the one who looks at the most outcrops.” Because of this, I am happy to have seen the cores we’ve collected so far—and I’m ready for more!
By Apollonia Arellano


Apollonia and Allison sampling a multicore (they work very fast!)
Meet The Scientific Crew
Hi! My name is Ashley Rodriguez, I’m originally from East Los Angeles, California and I’ve just finished my sophomore year at Middlebury College. I came to Middlebury with the clear goal of studying biodiversity and the recovery of keystone species. I’m still passionate about these research questions but my role aboard the Celtic Explorer is quite different, shaped by my work with Allison and the questions her lab addresses.
I started working for in the FOR@M (Facility for Oceanographic Research @ Middlebury) with Allison as a research assistant in January of 2023. It was there that I was introduced to the world of paleoceanography. What first seemed like little slices of mud quickly turned into exciting discoveries about the rich history of the Pacific Ocean which can help provide insights into Earth’s future climate.
In the lab, I was tasked with processing a sediment core from the tropical Pacific Ocean, quantifying the % coarse fraction (the fraction of the sediment larger than 63 microns), identifying and picking out hundreds of individual G. ruber (Figure 1), an abundant subtropical foraminifera species, from various core depths. The samples I selected were then sent to Woods Hole Oceanographic Institution where they were analyzed for δ 18 O and 14 C, two geochemical indicators that can help us determine the age of the samples, as well as what environmental conditions were like hundreds of thousands of years ago.
At the end of the semester, Allison proposed an amazing opportunity to continue our paleoceanographic work aboard the Celtic Explorer in the Nordic Seas. We’re here on an expedition to assess the rapidly warming Arctic and the changes it is bringing to the surface waters, the biodiversity, and the sediments below. We’ll use records of past change to better understand modern warming and what the future might hold.
Written by Ashley Rodriguez
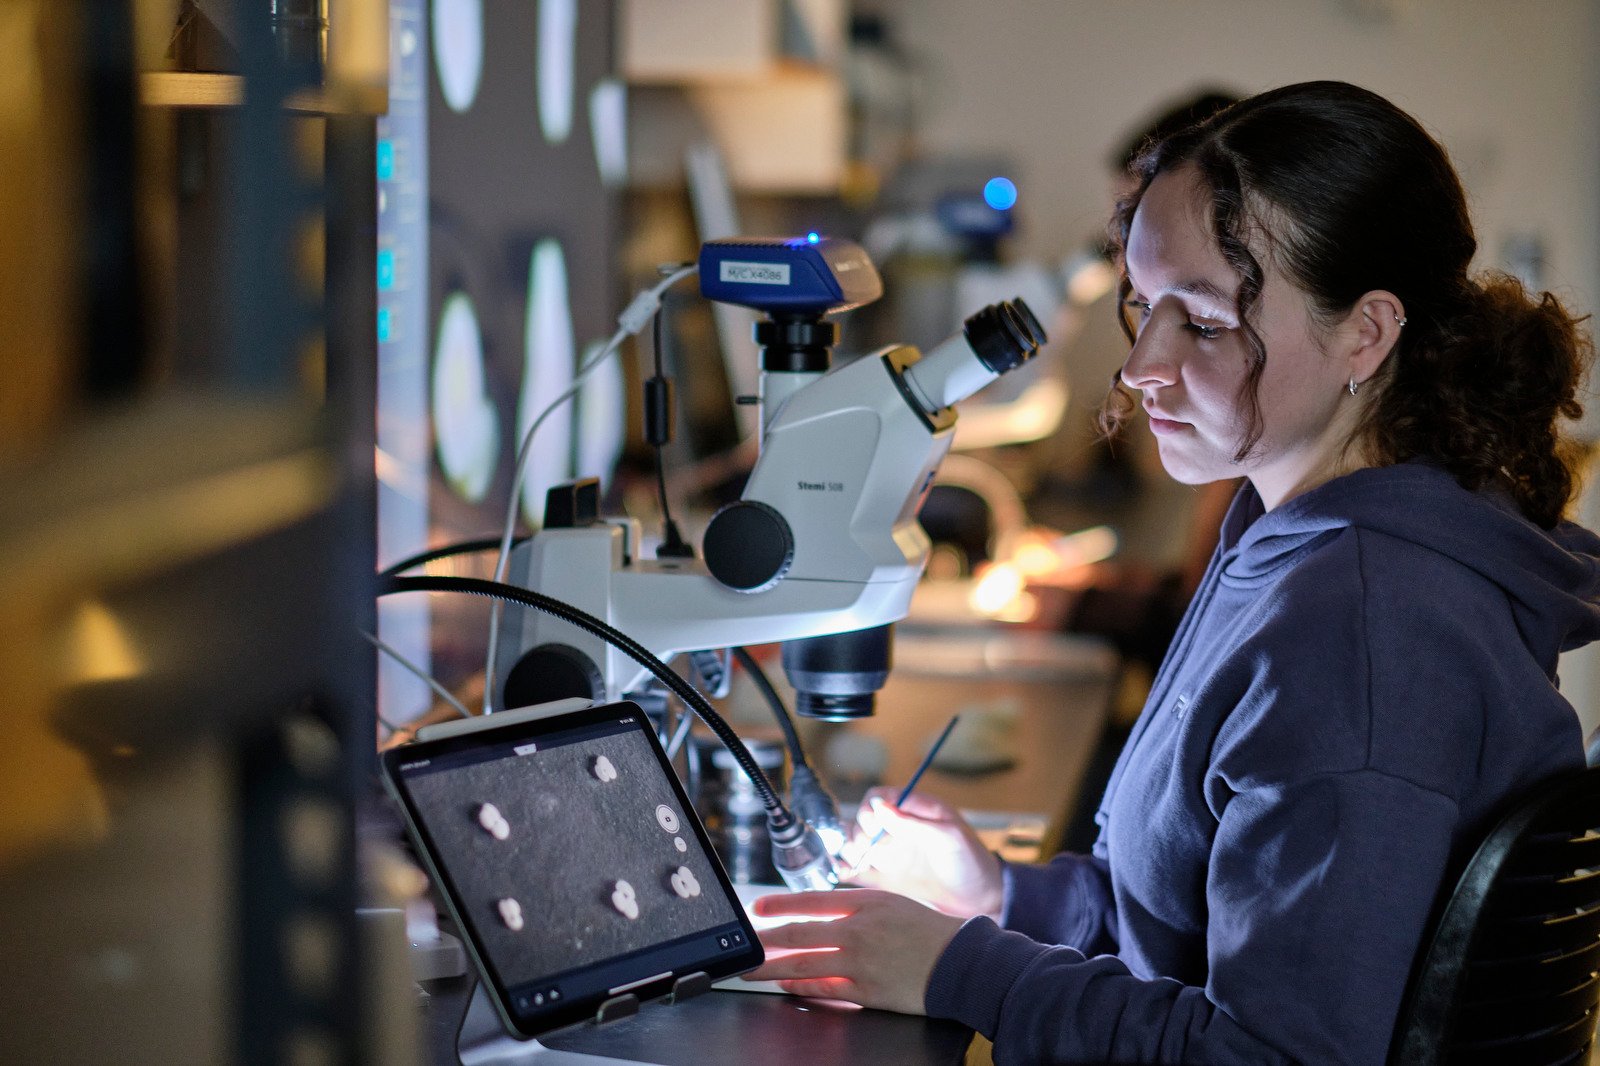
Middlebury undergraduate student Ashley Rodriguez at work using a stereomicroscope in the FOR@M

Individual G. ruber specimen photographed on a Scanning Electron Microscope (SEM) by Middlebury College student Shane Lusk.
Joining the ship

Today we joined the RV Celtic Explorer in Killybegs, IE. We spent the afternoon unpacking our gear and tying down instruments and boxes so that they don’t go flying when we leave the safety of the harbor and enter the open ocean. Tonight we’ll be slipping out of the harbor towards a spot of calm winds for our first CTD of the cruise, tomorrow morning.

Current wind speeds broadcast to the dry lab along with our current location (red ship) and first station (the red dot off of the blue line connected to the ship).
CTD stands for conductivity, temperature, and depth and is a piece of equipment that gives us a sense of how the ocean’s physical characteristics vary right beneath our feet. We lower the CTD on a long wire that comes off the ship and get real-time data about these properties (and more) as the device descends. The CTD also carries niskin bottles (basically giant Nalgene bottles) that we can snap shut remotely, meaning that we can retrieve samples of water from various ocean depths to study for nutrient concentrations, pH, isotopes and more. The CTD will always be the first piece of equipment we deploy when we come on station as it helps us get a sense of water column conditions and also provides water for the live plankton (forams) we will be bringing aboard. More about that soon!
Below is a picture of Middlebury students deploying a mini CTD aboard the RV Folger during Prof. Jacobel’s Fall 2022 Oceans and Coastlines course.

Welcome to our blog for SiTrAC: Signal Tracking to unveil Arctic Climate variability
Middlebury undergraduate Ashley Rodriguez and I are thrilled to be joining the SiTrAC cruise aboard the RV Celtic Explorer (photo at right) led by Chief Scientist Dr. Audrey Morley of the University of Galway. SiTrAC is an acronym for Signal Tracking to unveil Arctic Climate variability, which is exactly what we’ll be doing during our month out at sea (tentative ship track below). We’ll be part of a team of scientists that also includes Columbia University graduate student Apollonia Arellano.

Black line shows the tentative cruise track for SiTrAC. Symbols indicate pre-existing sediment core sites, some of which we may re-core on this cruise.
Watch this space for posts by Allison, Ashely, and Apollonia about:
Our preparations for the cruise
Life aboard a research ship
The instruments we’re deploying to trace Arctic change - past and present
How we reconstruct past change from marine sediments
The specific research questions members of the scientific party are interested in answering
The charismatic megafauna we spot

Photo of the RV Celtic Explorer from the Irish Marine Institute
The Nordic Seas are experiencing some of the fastest rates and largest magnitudes of climate change on the planet (SST anomaly plot below). We are interested in studying these changes and using past episodes of abrupt climate change, recorded in the marine sediments at the bottom of the ocean, to help understand what future change will look like. We are especially interested in these sites because they play an outsize role in the Atlantic Meridional Overturning Circulation which drives global ocean circulation and climate (more on that later).

North Atlantic sea surface temperature anomalies from 2022 relative to the ‘97-90 reference interval. Figure made using U Maine’s Climate Reanalyzer.
New Lab Logo
At the prodding of Middlebury summer research assistants Lily Applebaum and Hugh Easton I have finally finished a draft of the FOR@M (Facility for Oceanographic Research @ Middlebury) logo! Based on the silhouette of a Cibicidoides wuellerstorfi (symbolizing our work on trace element proxies in foraminifera) this seems like a strong way to end the Summer 2022 research season. Thanks to Lily and Hugh for their hard work and (reciprocal) encouragement!

New NSF Grant!
I am very excited to have received NSF funding for a 3-year P2C2 project entitled “Glacial deep Pacific carbon storage and effects on CaCO3 preservation.” This work is a collaborative project with Dr. Kassandra Costa at Woods Hole Oceanographic Institution with Middlebury College as the lead institution.
Modified from the proposal abstract: The oceans are threatened by climate change, and understanding how they will respond to higher CO2 levels has never been more important. Past changes in the ocean’s carbon cycle can provide data to check and improve models that help us predict future changes. These data can also help us ‘balance’ Earth’s carbon budget by showing where and how much carbon was stored in the ocean at times when the Earth has been much colder.
This research includes roles and funding for undergraduate and graduate students and increases access to information about climate change by creating activities for high school classrooms (partnership with Middlebury Union High School). This work thus advances discovery, integrates research and education, increases the participation of underrepresented groups in the geosciences, and fosters the inclusion of the public in fundamental science research.
The project is jointly funded by OCE-Marine Geology and Geophysics (OCE-MGG) and the Established Program to Stimulate Competitive Research (EPSCoR).
New Job!
I am absolutely thrilled to have accepted a position with Middlebury College's Geology Department for the 2020-2021 academic year. The current plan (COVID-willing) is for me to teach Elements of Oceanography (with lab) in the fall of 2020, and How to Build a Habitable Planet, and Earth’s Climate History (with lab) in spring of 2021.
If you are a Middlebury student interested in doing paleoclimate research with me (semester or summer) please do not hesitate to get in touch (ajacobel<at>middlebury.edu)!
Cheers,
Allison